Chapter 10 Clustering - Hierarchical and k-Means
10.1 Hierarchical Clustering
The point of clustering is to organize observations that are close together and separate them into groups. Closeness is generally a measure of distance between observations, the primary measures being Euclidean, Manhattan or Cosine. You just have to pick the one that makes sense for your situation. For most uses, Euclidean distance (often the default) does a great job, but occasionally cosine distances are more useful when doing natural language analysis.
The dist function in R calculates distances. It works on any numeric data frame or matrix. The default method is Euclidean. If the dataframe has a non-numeric value, the results contain a warning and are inaccurate. The calculations for the dist function are replicable in Excel - the distance between any two rows is sqrt((col1 - col2)^2 + ...).
To be able to do hierarchical clustering, we need the distance. We use the function hclust to get the clusters, which can then be plotted as a dendrogram using plot.
data(mtcars)
plot(hclust(dist(mtcars)))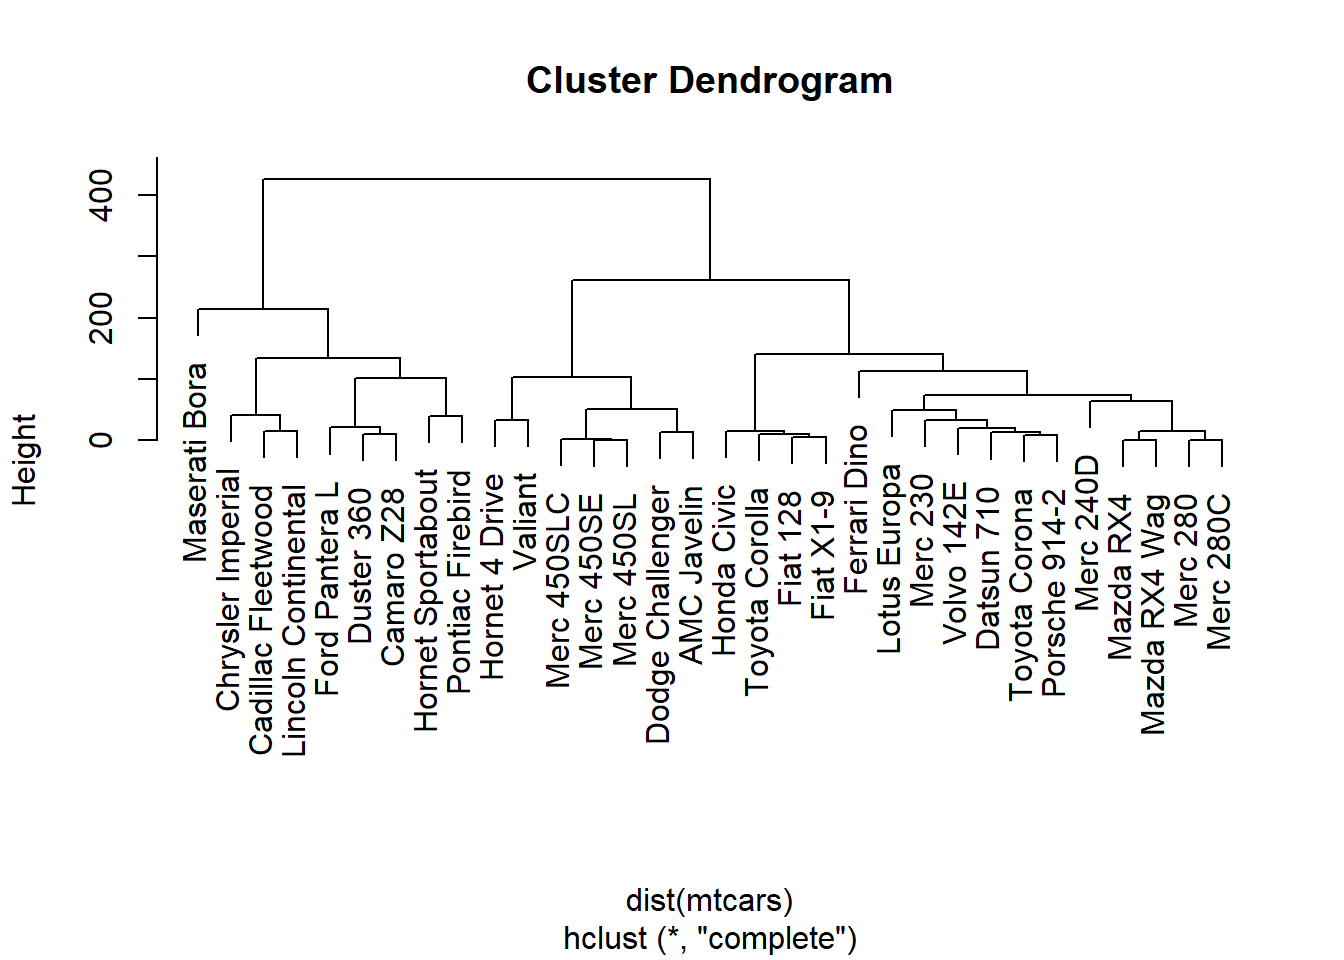
Let us do this a bit slowly, one step at a time.
mydist = dist(mtcars) #calculate distance
mycluster = hclust(mydist) #create clusters
mydendro = as.dendrogram(mycluster) #create dendrogram
plot(mydendro) #plot dendrogram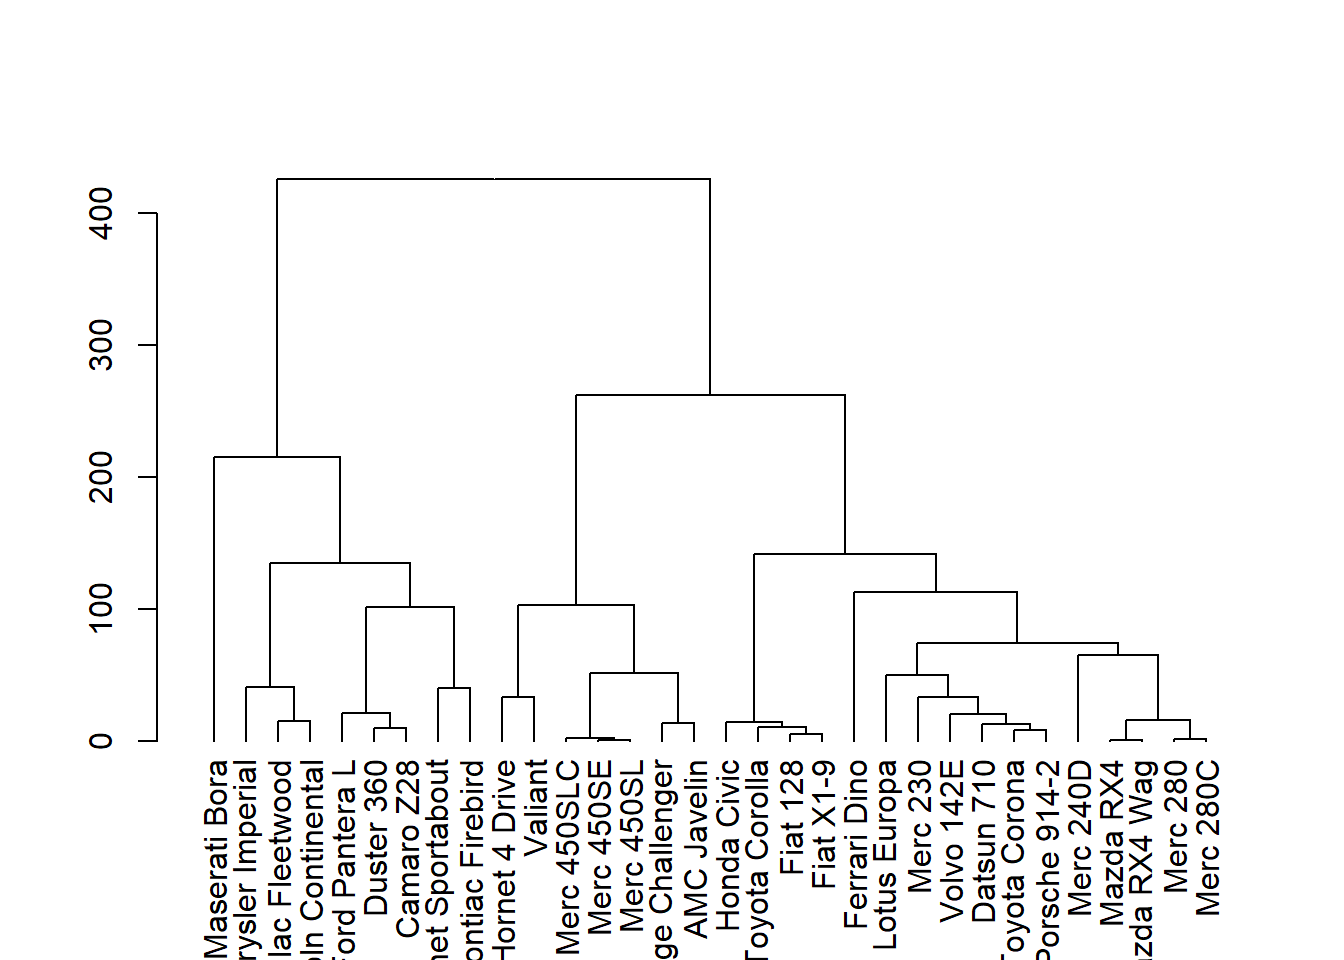
Now let us look at mydendro
mydendro## 'dendrogram' with 2 branches and 32 members total, at height 425.3447Question is, what can you do with this? Answer is, that by ‘cutting’ the dendrogram at the right height, you can get any number of clusters or groups that you desire.
cutree(mycluster, k = 3)## Mazda RX4 Mazda RX4 Wag Datsun 710
## 1 1 1
## Hornet 4 Drive Hornet Sportabout Valiant
## 2 3 2
## Duster 360 Merc 240D Merc 230
## 3 1 1
## Merc 280 Merc 280C Merc 450SE
## 1 1 2
## Merc 450SL Merc 450SLC Cadillac Fleetwood
## 2 2 3
## Lincoln Continental Chrysler Imperial Fiat 128
## 3 3 1
## Honda Civic Toyota Corolla Toyota Corona
## 1 1 1
## Dodge Challenger AMC Javelin Camaro Z28
## 2 2 3
## Pontiac Firebird Fiat X1-9 Porsche 914-2
## 3 1 1
## Lotus Europa Ford Pantera L Ferrari Dino
## 1 3 1
## Maserati Bora Volvo 142E
## 3 1cutree(mycluster, k = 2:5)## 2 3 4 5
## Mazda RX4 1 1 1 1
## Mazda RX4 Wag 1 1 1 1
## Datsun 710 1 1 1 1
## Hornet 4 Drive 1 2 2 2
## Hornet Sportabout 2 3 3 3
## Valiant 1 2 2 2
## Duster 360 2 3 3 3
## Merc 240D 1 1 1 1
## Merc 230 1 1 1 1
## Merc 280 1 1 1 1
## Merc 280C 1 1 1 1
## Merc 450SE 1 2 2 2
## Merc 450SL 1 2 2 2
## Merc 450SLC 1 2 2 2
## Cadillac Fleetwood 2 3 3 3
## Lincoln Continental 2 3 3 3
## Chrysler Imperial 2 3 3 3
## Fiat 128 1 1 1 4
## Honda Civic 1 1 1 4
## Toyota Corolla 1 1 1 4
## Toyota Corona 1 1 1 1
## Dodge Challenger 1 2 2 2
## AMC Javelin 1 2 2 2
## Camaro Z28 2 3 3 3
## Pontiac Firebird 2 3 3 3
## Fiat X1-9 1 1 1 4
## Porsche 914-2 1 1 1 1
## Lotus Europa 1 1 1 1
## Ford Pantera L 2 3 3 3
## Ferrari Dino 1 1 1 1
## Maserati Bora 2 3 4 5
## Volvo 142E 1 1 1 1Simply displaying cluster numbers isn’t very helpful, we might also want to see how many items in each cluster.
mytree = cutree(mycluster, k = 3)
table(mytree)## mytree
## 1 2 3
## 16 7 910.2 K-means clustering
K-means clusters data in a given number of clusters by using an iterative algorithm. As for hierarchical clustering, different distance measures can be applied. As a default, we need to provide the number of clusters.
kmeansfit = kmeans(mtcars, 3) # three is the number of clusters
kmeansfit## K-means clustering with 3 clusters of sizes 16, 7, 9
##
## Cluster means:
## mpg cyl disp hp drat wt qsec vs
## 1 24.50000 4.625000 122.2937 96.8750 4.002500 2.518000 18.54312 0.7500000
## 2 17.01429 7.428571 276.0571 150.7143 2.994286 3.601429 18.11857 0.2857143
## 3 14.64444 8.000000 388.2222 232.1111 3.343333 4.161556 16.40444 0.0000000
## am gear carb
## 1 0.6875000 4.125000 2.437500
## 2 0.0000000 3.000000 2.142857
## 3 0.2222222 3.444444 4.000000
##
## Clustering vector:
##           Mazda RX4       Mazda RX4 Wag          Datsun 710
##                   1                   1                   1
##      Hornet 4 Drive   Hornet Sportabout             Valiant
##                   2                   3                   2
##          Duster 360           Merc 240D            Merc 230
##                   3                   1                   1
##            Merc 280           Merc 280C          Merc 450SE
##                   1                   1                   2
##          Merc 450SL         Merc 450SLC  Cadillac Fleetwood
##                   2                   2                   3
## Lincoln Continental   Chrysler Imperial            Fiat 128
##                   3                   3                   1
##         Honda Civic      Toyota Corolla       Toyota Corona
##                   1                   1                   1
##    Dodge Challenger         AMC Javelin          Camaro Z28
##                   2                   2                   3
##    Pontiac Firebird           Fiat X1-9       Porsche 914-2
##                   3                   1                   1
##        Lotus Europa      Ford Pantera L        Ferrari Dino
##                   1                   3                   1
##       Maserati Bora          Volvo 142E
##                   3                   1
##
## Within cluster sum of squares by cluster:
## [1] 32838.00 11846.09 46659.32
## (between_SS / total_SS = 85.3 %)
##
## Available components:
##
## [1] "cluster" "centers" "totss" "withinss"
## [5] "tot.withinss" "betweenss" "size" "iter"
## [9] "ifault"It is as simple as that!
You can add the cluster names as a column to the data frame.
mtcars$kmeanscluster = kmeansfit$cluster