Chapter 5 R Graphics
5.1 Why graphics?
You need graphics to explore the data. You need graphics to compare data, show explanation, causality, trends, show multivariate data, annotate with text and integrate evidence.
In R, you have multiple graphing systems available. We will cover two of the most used - the base R plotting system, and ggplot2. The base R plotting system provides basic graphing capabilities with a parsimonious function set - very quick, elegant, and gets the job done quickly. For more complex graphics and complete control at the lowest level of detail, we use ggplot2.
We will cover a couple of different types of commonly used graphs - the scatterplot, the line graph, the histogram, the barplot, and the boxplot. For each of these, we will see how to modify the colors, axis, add text, ablines etc.
5.2 Base graphics
In base R graphics, you create a graph, and then add elements to it one by one on top. As if you are adding layers.
5.2.1 Boxplots
A boxplot plots a single variable. Allows you to identify outliers very quickly:
* The top and bottom of the box are the 1st and the 3rd quartile.
* The ‘whiskers` extend to 1.5 times the height of the box (which is 3rd minus 1st quartile, called the inter-quartile range).
* All points beyond the ’whiskers’ are shown as outliers.
Let us try it out. mpg in the mtcars dataset is a set of datapoints, and we can check how the boxplot looks.
boxplot(mtcars$mpg)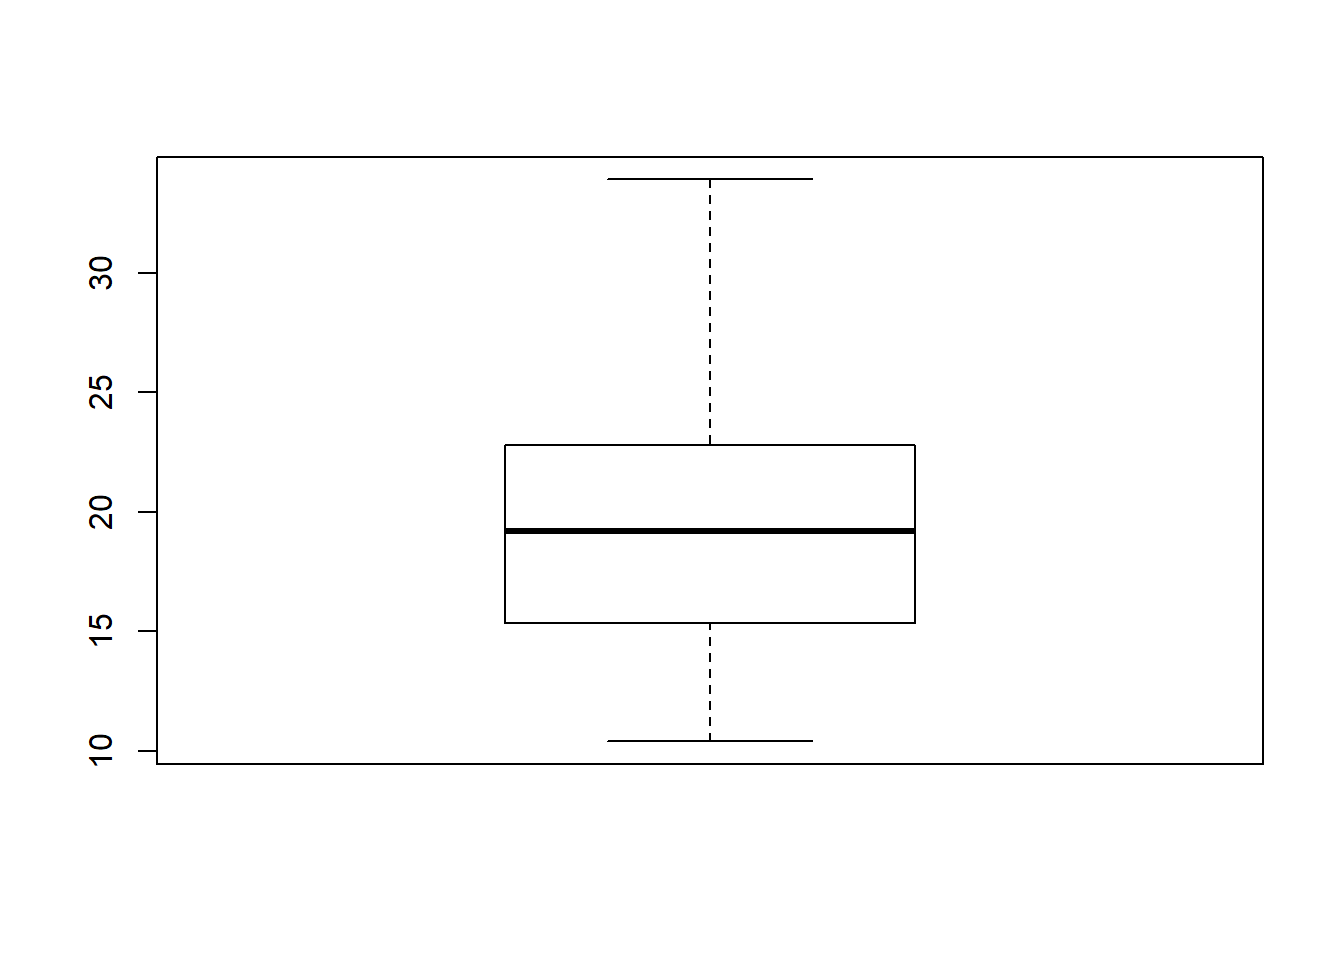
We can verify if the numbers are plotted correctly:
summary(mtcars$mpg)## Min. 1st Qu. Median Mean 3rd Qu. Max.
## 10.40 15.43 19.20 20.09 22.80 33.90Make the boxplot more useful, create the chart by the number of gears in the car. We add ~ gear to the command as below:
boxplot(mtcars$mpg ~ mtcars$gear)
Add color
boxplot(mtcars$mpg ~ mtcars$gear, col = "blue")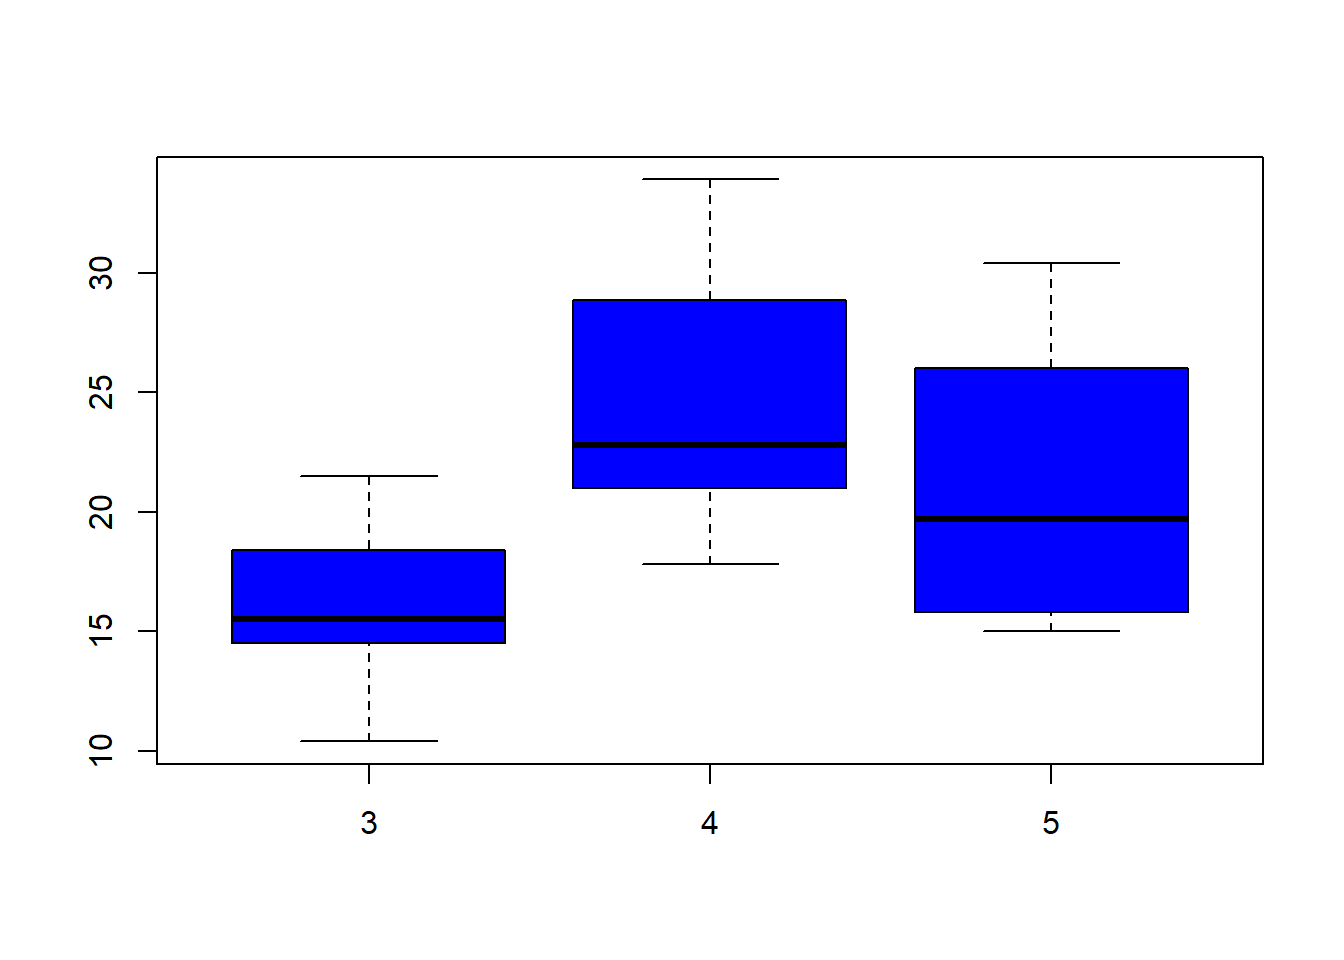
5.2.2 Histogram
Let us now create a histogram. Like the boxplot, it too plots only a single variable.
hist(mtcars$mpg, col="green") # Create the histogram
rug(mtcars$mpg) # Add a rug to the bottom, like a frequency plot
hist(mtcars$mpg, col="green", breaks = 20) # More histogram fun - you can control the number of breaks.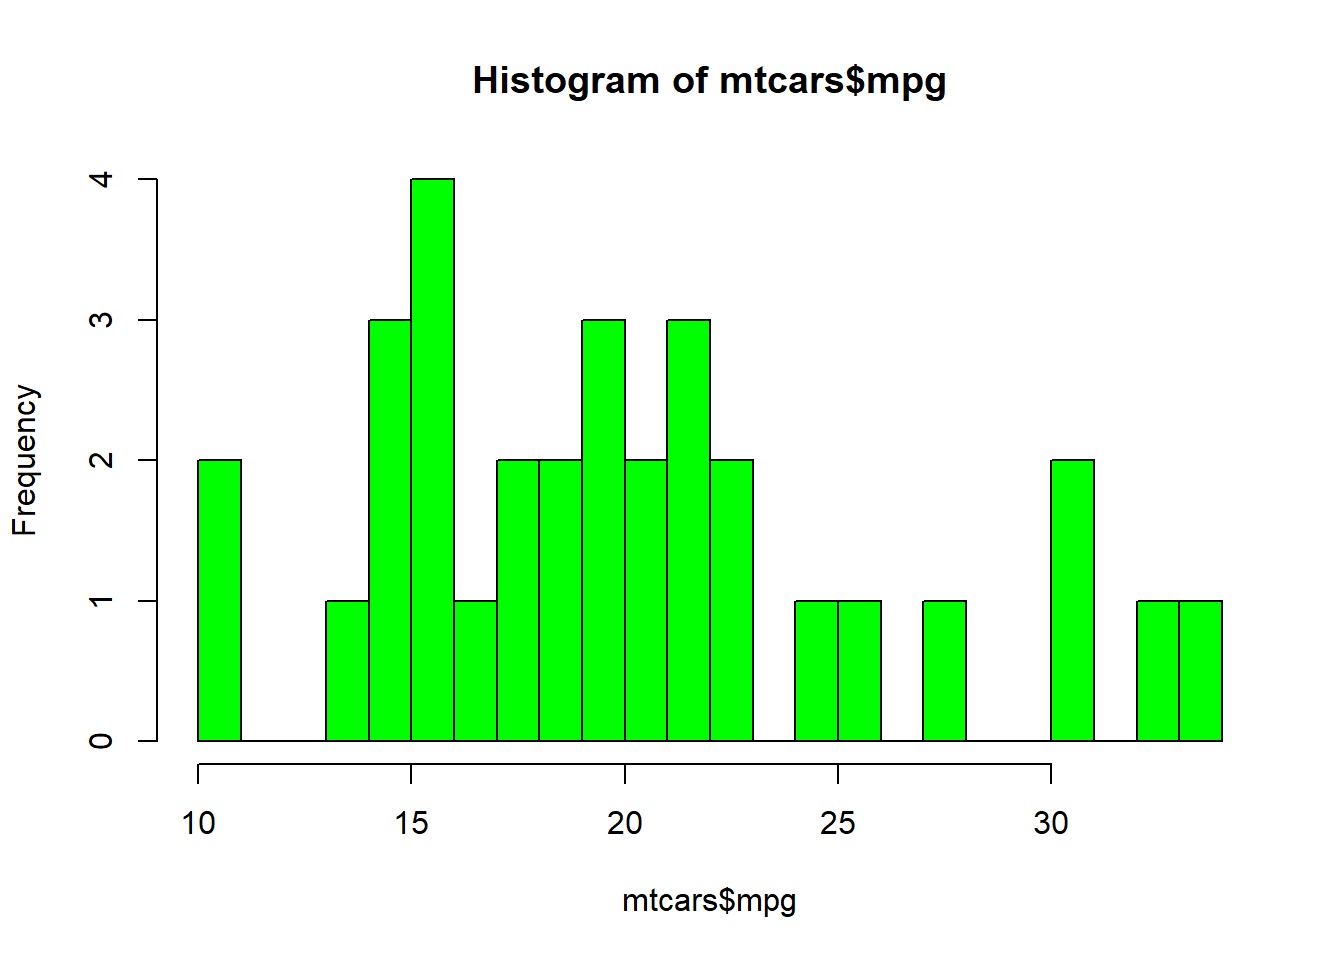
Adding an abline - An abline (pronounced A-B-Line) is exactly that, it adds a straight line anywhere in the plot. You might need to insert it to show the mean, or a threshold. It can be horizontal, eg abline(h = 1.7, col="red"), or vertical, eg abline(v=18, lwd=2) where lwd is the line width, or at an angle, eg abline(a = 1, b = .1, col="blue") where a and b are the intercept and the slope respectively. Try it out.
5.2.3 Barplot
A barplot summarizes categorical data - so it needs two variables. First, the category, and then the value for each category. For example, country, and GDP. A barplot looks like a histogram and people get confused between the two, but there is an important difference between the two!
barplot(mtcars$mpg)
barplot(mtcars$mpg, names.arg=rownames(mtcars))
5.2.4 Scatterplot
A scatterplot needs two variables, one for each of the axis. The command is simple: plot().
plot(mtcars$mpg, mtcars$disp) #Plot miles per gallon against engine displacement (ie size)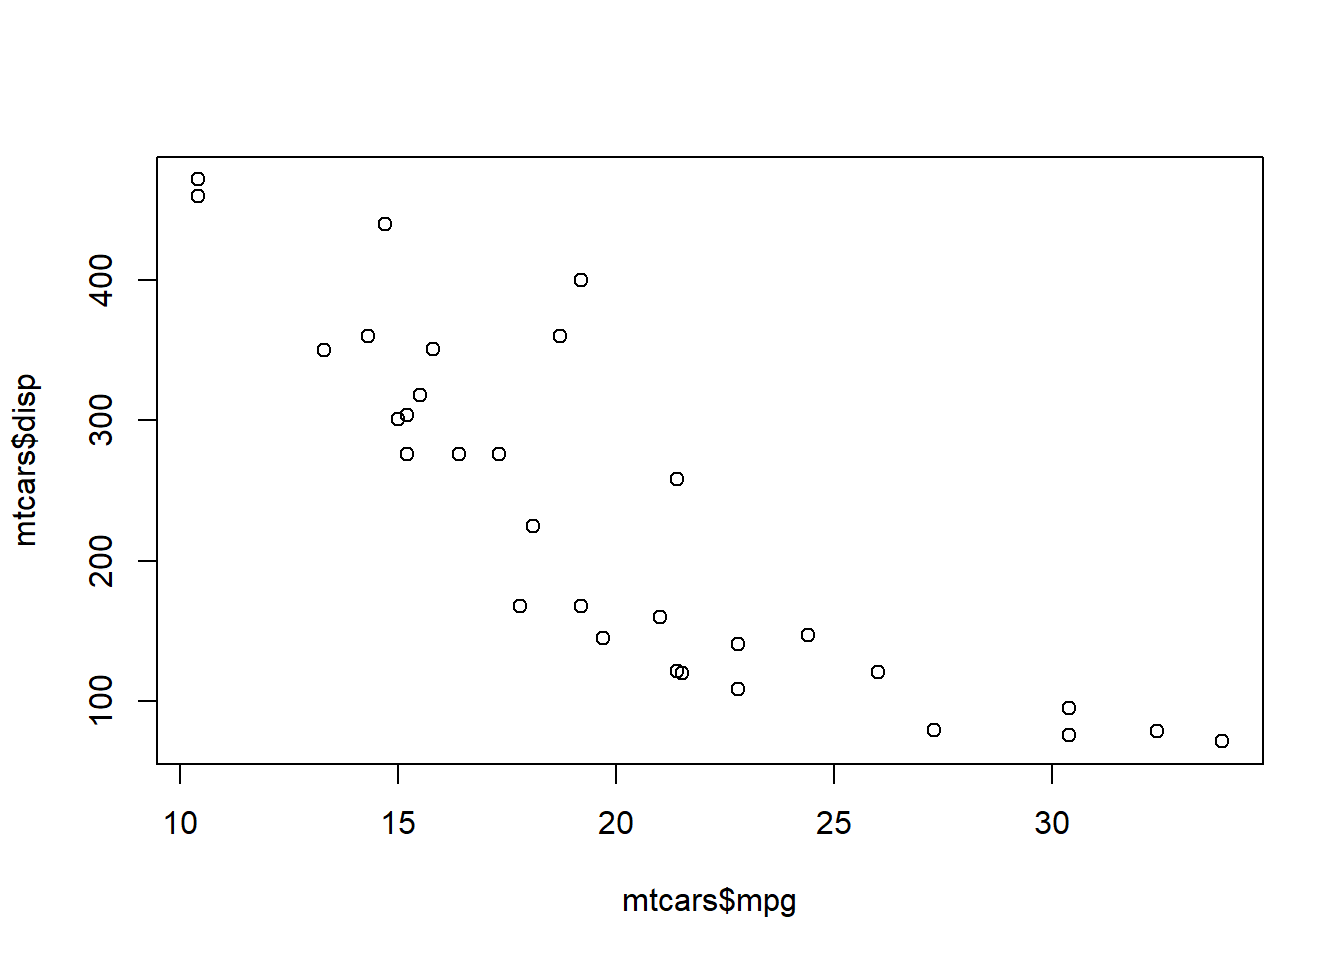
In the base plotting system, there are global parameters to the look and feel that you can use with all kinds of plots.
- pch: plotting character (default is open circle)
- lty: line type (default is solid line), can be dashed, dotted, etc.
- lwd: line width, specified as an integer multiple
- col: color, specified as a number, string, or hex code; the colors() function gives you a vector of colors by name
- xlab: x-axis label
- ylab: y-axis label
To examine the power of the above, consider this: Generally you can only create 2-dimensional graphs. The above parameters allow you to add many more dimensions in a clever way. Consider the following:
plot(mtcars$mpg, mtcars$disp, col = mtcars$gear, pch = mtcars$cyl)
But not very useful without a legend, which is why we quickly move on to ggplot2