Chapter 7 Regression
Let us look at the graph below - think about the relationship between mpg and engine displacement.
library(ggplot2)
data(mtcars)
ggplot(mtcars, aes(disp, mpg)) + geom_point() + geom_smooth(method = "lm")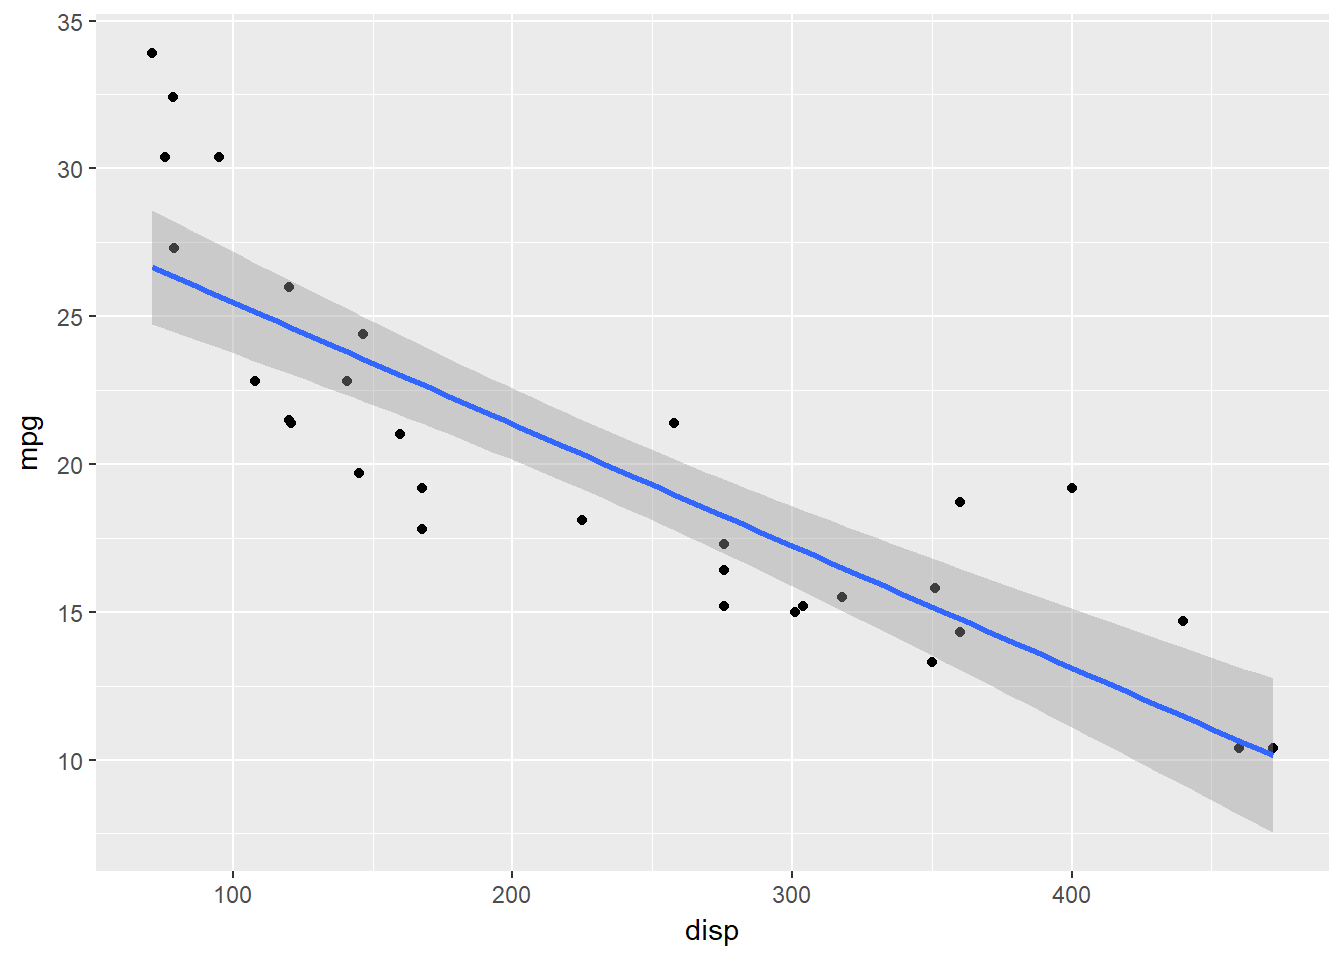
How do we define the line? beta0 is the intercept, and beta1 is the slope.
y = mtcars$mpg
x = mtcars$disp
beta1 = cor(y,x) * sd(y)/sd(x)
beta0 = mean(y) - beta1*mean(x)
beta0
## [1] 29.59985beta1## [1] -0.04121512coef(lm(mpg ~ disp, mtcars))## (Intercept) disp
## 29.59985476 -0.041215127.0.1 Regression to the mean
Note that y = beta0 + beta1 * x. Now recall the formula for beta1 - it is cor(y,x) * sd(y)/sd(x). Imagine scaled variables where the sd is 1, or both variables have similar standard deviations. that just leaves us with cor(y,x) which is less than 1. That means continued multiplication with this quantity pushes us closer to the mean, hence the phrase regression to the mean.
7.1 Residuals
Residuals help identify poor model fit. Specifically, residuals can be thought of as the outcome y with the effect of the predictor removed. Always plot the residuals - first on their own, then with the X variable.
fit = lm(mpg ~ disp, mtcars)
plot(fit$residuals)
plot(mtcars$disp, fit$residuals)
As one would expect, the correlation between residuals and the X variable should be close to zero. Also the errors are supposed to be Gaussian with a constant error. They are expected to distributed normally with N(0, sd^2). sd^2 is the variance of the population error.
cor(mtcars$disp, fit$residuals)## [1] -4.475486e-177.2 Summary gives all the variables
Also the errors are supposed to be Gaussian with a constant error. They are expected to distributed normally with N(0, sd^2). sd^2 is the variance of the population error.
summary(fit)##
## Call:
## lm(formula = mpg ~ disp, data = mtcars)
##
## Residuals:
## Min 1Q Median 3Q Max
## -4.8922 -2.2022 -0.9631 1.6272 7.2305
##
## Coefficients:
## Estimate Std. Error t value Pr(>|t|)
## (Intercept) 29.599855 1.229720 24.070 < 2e-16 ***
## disp -0.041215 0.004712 -8.747 9.38e-10 ***
## ---
## Signif. codes: 0 '***' 0.001 '**' 0.01 '*' 0.05 '.' 0.1 ' ' 1
##
## Residual standard error: 3.251 on 30 degrees of freedom
## Multiple R-squared: 0.7183, Adjusted R-squared: 0.709
## F-statistic: 76.51 on 1 and 30 DF, p-value: 9.38e-10- You see the formula, distribution of the residuals, and the coefficients for beta0 and beta1
- In the table, you see the standard error (ie sd) for the coefficients, and the t value and the p value
7.2.1 What is the Std. Error?
Our regression model provides us values for alpha and beta. These, after all, are only estimates. We can assess how good these estimates are, and how ‘significant’ they are. As estimates, the calculated values represent point estimates that have a range of possibilities for the true value to be on either side of this estimate - depending upon their standard deviation.
Once the standard deviations, or the standard errors of the coefficients are known, we can determine confidence levels to determine the ranges within which these estimated values of the coefficients lie at a certain level of significance.
7.2.2 What is the t value
It is simply the estimate divided by the Std. Error.
7.2.3 What is Multiple R-Squared?
Intuitively, the regression line given by alpha + beta*x will be a more accurate prediction of y if the correlation between x and y is high. We don’t any math to say that if the correlation between the variables is low, then the quality of the regression model will be lower because the regression model is merely trying to fit a straight line on the scatter plot in the best possible way.
Generally, R2, called the coefficient of determination, is used to evaluate how good the ‘fit’ of the regression model is. R2 is calculated as ESS/TSS, ie the ratio of the explained variation to the total variation.
R2 = ESS/TSS
R2 is also the same thing as the square of the correlation (stated without proof, but you can verify it). Which means that our initial intuition that the quality of our regression model depends upon the correlation of the variables was correct. (Note that in the ratio ESS/TSS, both the numerator and denominator are squares of some sort - which means this ratio explains how much of the ‘variance’ is explained, not standard deviation. Variance is always in terms of the square of the units, which makes it slightly difficult to interpret intuitively, which is why we have standard deviation.)
7.2.4 What is the F-statistic?
Now the question arises as to how ‘significant’ is any given value of R2? When we speak of ‘significance’ in statistics, what we mean is the probability of the variable in question being right. It means that we believe that the variable or parameter in question has a distribution, and we want to determine if the given value falls within the confidence interval (95%, 99% etc) that we are comfortable with.
Estimates follow distributions, and often we see statements such as a particular variable follows the normal or lognormal distribution. The value of R2 follows what is called an F-distribution. (The answer to why R2 would follow an F distribution is beyond the mathematical abilities of this author - so just take it as a given.) The F-distribution has two parameters - the degrees of freedom for each of the two variables ESS and TSS that have gone into calculating R2. The F-distribution has a minimum of zero, and approaches zero to the right of the distribution. In order to test the significance of R2, one needs to calculate the F statistic as follows:
F statistic = ESS / (RSS/(T-2)), where T is the number of observations. We subtract 2 to account for the loss of two degrees of freedom. This F statistic can then be compared to the value of the F statistic at the desired level of confidence to determine its significance.
All of the above about the F statistic is best explained with an example:
Imagine ESS = 70, TSS = 100, and T=10 (all made up numbers).
In this case, R2 = 0.7 (=70/100)
Since ESS + RSS = TSS, RSS = 30 (= 100 - 20)
Therefore the F statistic = 20/(30/(10-2)) = 5.33
Assume we want to know if this F statistic is significant at 95%, in other words, could its value have been zero and we accidentally happened to pick a sample that we got an estimate that was 5.33? We find out what the F statistic should be at 95% - and compare that to the value of ‘5.33’ we just calculated. If ‘5.33’ is greater than the value at 95%, we conclude that R2 is significant at the 95% level of confidence (or is significant at 5%). If ‘5.33’ is less than what the F value is at the 95% level of confidence, we conclude the opposite.
The value of F distribution at the desired level of confidence (= 1 - level of significance) can be calculated using the function qf(.95, 1, 8) = 5.318. Since 5.33>5.318, we conclude that our R2 is significant at 5%.
We then go one step further - we can determine at what level does this F statistic become ‘critical’ - and we can do this using the pf function. In this case, pf(5.33, 1,8) = .95208, which happens to be quite close to 5%. The larger the value of the F statistic, the lower the value the FDIST function returns, which means a higher value of the F statistic is more desirable.
7.3 Analysis of the errors
TSS = RSS + ESS
where TSS is the total sum of squaures, RSS is the residual sum of squares, and ESS is the explained sum of squares.
There is no easy way to get ESS, TSS and RSS in R except through a recomputation.
RSS = sum((fit$residuals)^2); RSS## [1] 317.1587TSS = sum((y - mean(y))^2); TSS ## [1] 1126.047ESS = TSS - RSS; ESS## [1] 808.88857.4 SE of the predictor vs the line
If you had the entire population to build the regression line from, you would have a perfect regression line. The estimates for the line, ie its intercept and slope, would be perfect and precise. However still not every Y will fall on the this line due to unexplained factors, and even for such a perfect line you would have an SE of prediction. Now think you built the line from a sample, so your line itself could be a little bit misplaced from its true location. So the line has an SE of its own. The prediction confidence interval is therefore naturally larger than the CI for the line.
You can get either the CI of the line, or of the prediction by specifying the parameter interval = "confidence" or "prediction" in the predict function, which upon the inclusion of such a parameter returns a data frame with lower and upper confidence bounds as columns.
7.5 Predicting based on a model using predict
Of course, you predict for new data. You need to put the new x-values that you want the prediction for in a data frame. The column headings for the data frame should be the same as the independent variable names in the fitted model.
predict(fit, data.frame(disp = c(300, 350, 400)))## 1 2 3
## 17.23532 15.17456 13.11381predict(fit, data.frame(disp = c(300, 350, 400)), interval = "confidence") #prediction with CI for the line## fit lwr upr
## 1 17.23532 15.88537 18.58527
## 2 15.17456 13.53280 16.81632
## 3 13.11381 11.10598 15.12164predict(fit, data.frame(disp = c(300, 350, 400)), interval = "prediction") #prediction with CI for prediction## fit lwr upr
## 1 17.23532 10.459132 24.01151
## 2 15.17456 8.334262 22.01486
## 3 13.11381 6.176537 20.051087.6 Multivariate regression
Multivariate regression is quite similar in R to univariate regression. Assume the mpg variable is dependent upon not just disp, but also hp and wt.
fit2 = lm(mpg ~ disp + hp + wt, mtcars)
summary(fit2)
##
## Call:
## lm(formula = mpg ~ disp + hp + wt, data = mtcars)
##
## Residuals:
## Min 1Q Median 3Q Max
## -3.891 -1.640 -0.172 1.061 5.861
##
## Coefficients:
## Estimate Std. Error t value Pr(>|t|)
## (Intercept) 37.105505 2.110815 17.579 < 2e-16 ***
## disp -0.000937 0.010350 -0.091 0.92851
## hp -0.031157 0.011436 -2.724 0.01097 *
## wt -3.800891 1.066191 -3.565 0.00133 **
## ---
## Signif. codes: 0 '***' 0.001 '**' 0.01 '*' 0.05 '.' 0.1 ' ' 1
##
## Residual standard error: 2.639 on 28 degrees of freedom
## Multiple R-squared: 0.8268, Adjusted R-squared: 0.8083
## F-statistic: 44.57 on 3 and 28 DF, p-value: 8.65e-11Understanding the summary:
Now that we have more variables to predict from, we find that the quality of our prediction has improved. We compare the residual sum of squares and see it fall. Also notice the change in the coefficient value for disp.
sum((fit$residuals)^2); sum((fit2$residuals)^2)## [1] 317.1587## [1] 194.99077.7 Regression with a factor variable
Consider predicting mpg based on the number of cylinders - there are only three unique cylinder counts, and these are just categories and not numbers.
table(mtcars$cyl)##
## 4 6 8
## 11 7 14mtcars$cyl = factor(mtcars$cyl)Now we try regression and see what happens.
fit3 = lm(mpg ~ cyl, mtcars)
summary(fit3)
##
## Call:
## lm(formula = mpg ~ cyl, data = mtcars)
##
## Residuals:
## Min 1Q Median 3Q Max
## -5.2636 -1.8357 0.0286 1.3893 7.2364
##
## Coefficients:
## Estimate Std. Error t value Pr(>|t|)
## (Intercept) 26.6636 0.9718 27.437 < 2e-16 ***
## cyl6 -6.9208 1.5583 -4.441 0.000119 ***
## cyl8 -11.5636 1.2986 -8.905 8.57e-10 ***
## ---
## Signif. codes: 0 '***' 0.001 '**' 0.01 '*' 0.05 '.' 0.1 ' ' 1
##
## Residual standard error: 3.223 on 29 degrees of freedom
## Multiple R-squared: 0.7325, Adjusted R-squared: 0.714
## F-statistic: 39.7 on 2 and 29 DF, p-value: 4.979e-09So you see, you don’t have to create separate 0 and 1 variables, R takes care of that for us.
7.7.1 Dropping the intercept
You can drop the intercept by puting a - 1 in the formula. For example, let us redo the previous regression without the intercept.
fit3 = lm(mpg ~ cyl - 1, mtcars)
summary(fit3)
##
## Call:
## lm(formula = mpg ~ cyl - 1, data = mtcars)
##
## Residuals:
## Min 1Q Median 3Q Max
## -5.2636 -1.8357 0.0286 1.3893 7.2364
##
## Coefficients:
## Estimate Std. Error t value Pr(>|t|)
## cyl4 26.6636 0.9718 27.44 < 2e-16 ***
## cyl6 19.7429 1.2182 16.21 4.49e-16 ***
## cyl8 15.1000 0.8614 17.53 < 2e-16 ***
## ---
## Signif. codes: 0 '***' 0.001 '**' 0.01 '*' 0.05 '.' 0.1 ' ' 1
##
## Residual standard error: 3.223 on 29 degrees of freedom
## Multiple R-squared: 0.9785, Adjusted R-squared: 0.9763
## F-statistic: 440.9 on 3 and 29 DF, p-value: < 2.2e-16The coefficients are the mean for each cyl type.