Chapter 6 Introducing ggplot2
In gglplot2, you plot data from a data frame. ggplot2 is a much more structured and controlled way to build graphics in R. The code may be slightly longer, but you have total control, and you can reuse your work.
ggplot2 works only off data frames. Nothing else will do. You have to use a dataframe.
The way to think about ggplot2 graphics is this:
* a graph is a set of geoms, or geometric objects.
* The geoms draw their attributes, or aesthetics, from data.
6.1 Scatterplot
Consider the data frame mtcars again. Let us build a scatterplot plotting mpg against displacement.
data(mtcars)
library(ggplot2)
ggplot(mtcars, aes(x = mpg, y = disp)) + geom_point() 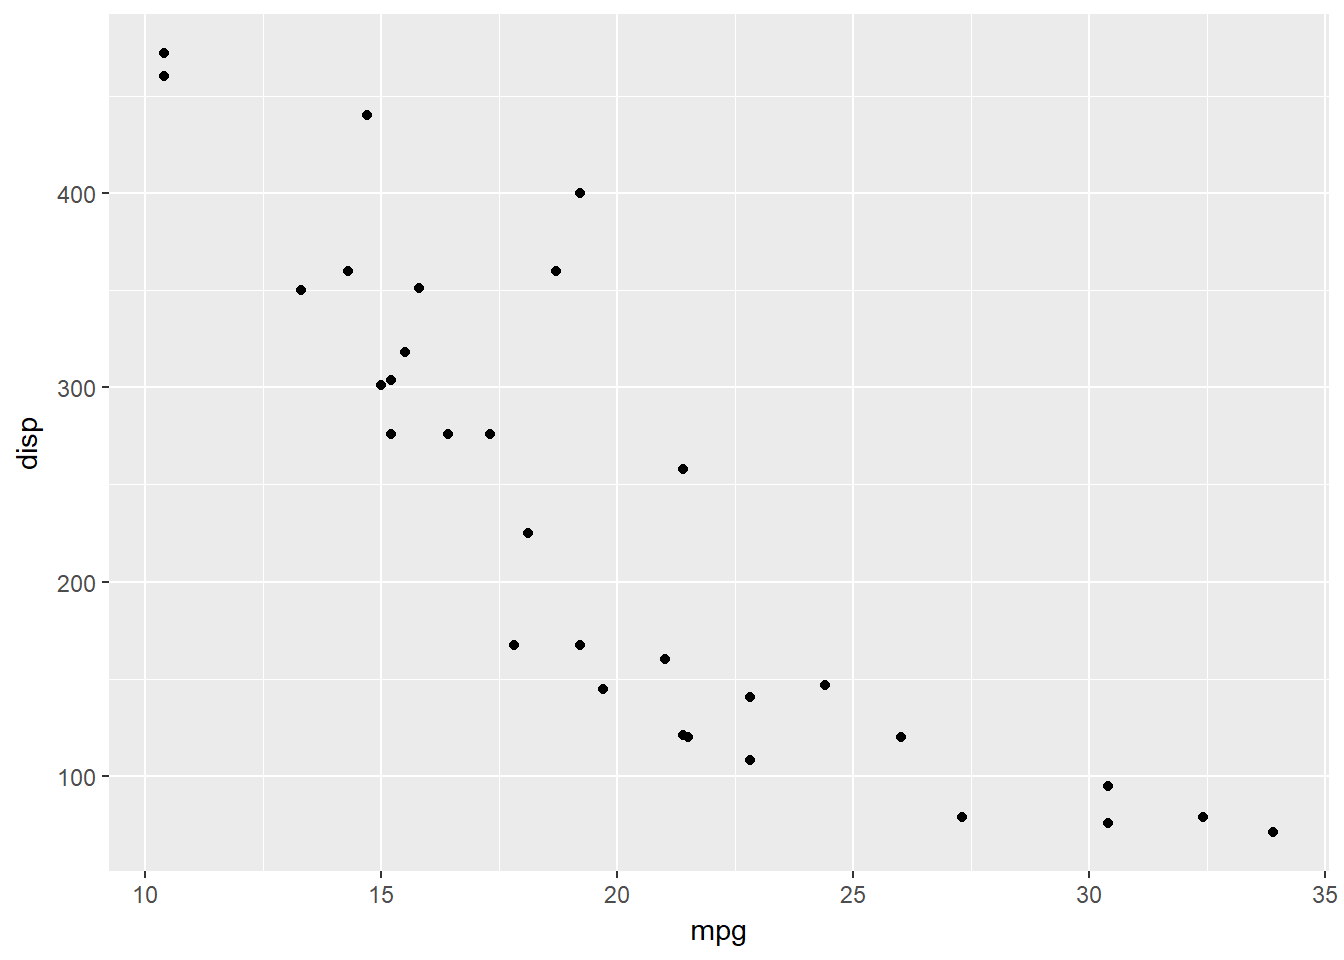
With ggplot2, you can build your graph iteratively using a formula.
mygraph = ggplot(mtcars, aes(x = mpg, y = disp)) + geom_point()
mygraph = mygraph + geom_smooth(method = "lm", se = FALSE)
mygraph = mygraph + geom_smooth(method = "loess", col = "red")
Now let us add additional variables to our data. For the code below, add lines one by one.
mygraph = ggplot(mtcars, aes(x = mpg, y = disp)) + # Tell ggplot2 where to find the data
        geom_point(aes(color = factor(mtcars$gear), size = factor(am), pch = factor(mtcars$cyl))) + #Add the points
        geom_smooth(size = 2, linetype = 2, method = "loess", se = TRUE, color = "blue") + #Add the smoother
        labs(title = "MPG vs Displacement", x = "Miles Per Gallon", y = "Displacement") + #Add graph and axis titles
        scale_colour_discrete(name = "Gears") + #Change titles for legend
        scale_size_discrete(name = "Auto/Manual") +
        scale_shape_discrete(name = "Cylinders")

mygraph
# To limit the axis, you would add `coord_cartesian(ylim - c(-3, 3))`, for exampleTo control the color, size and plotting character, we need to supply data. Data always needs to be in the aes envelope. Since this is only for geom_point, we include this in the aes call for geom_point. Note the conversion to factor. If we did not do that, ggplot2 will treat these as continuous variables, which is okay for color and size as they can vary according to a continuous scale. But plotting character is not continuous, so that at the minimum needs to be categorical, which is why we convert the cyl variable to a factor. We convert the other two even though it was not necessary because that is the result we wanted.
6.2 Histogram
A histogram only needs one variable x.
ggplot(mtcars, aes(x = mpg)) + geom_histogram(color = "red", fill = "yellow")
6.3 Plotting density
Sometimes you want the density curve for data. Use geom_density().
ggplot(mtcars, aes(x = mpg)) + geom_density()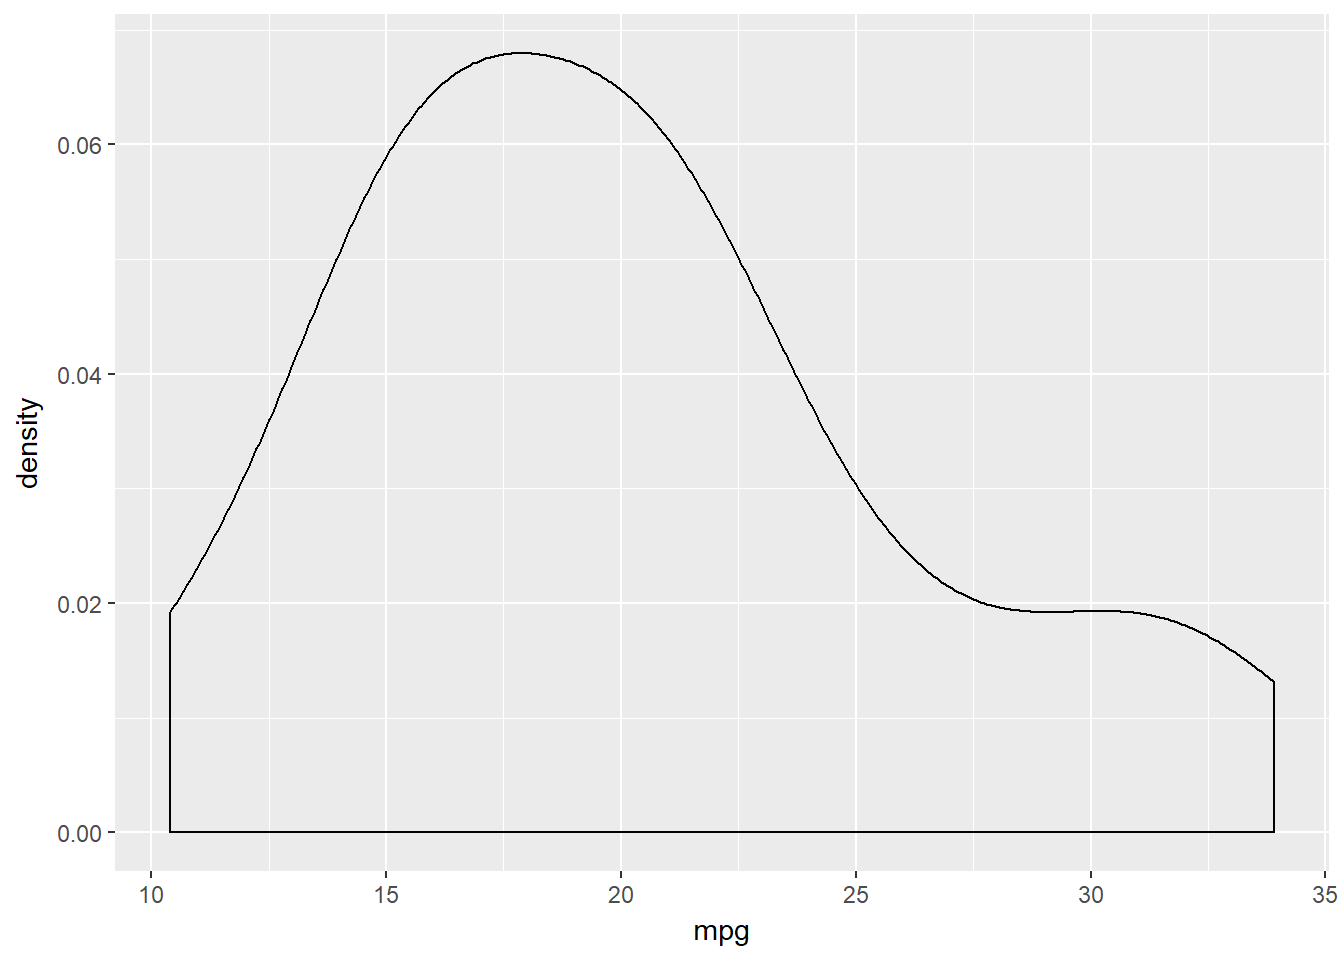
# overlay histogram with density curve
ggplot(mtcars, aes(x = mpg)) +
        geom_histogram(aes(y=..density..), color = "red", fill = "yellow", bins = 10) +
        geom_density(adjust=.5, size=1, fill = "red", alpha = .1)
You can also use geom_line(stat="density")
ggplot(mtcars, aes(x = mpg)) +
        geom_histogram(aes(y=..density..), color = "red", fill = "yellow", bins = 10) +
        geom_line(stat="density", color="blue", size = 1)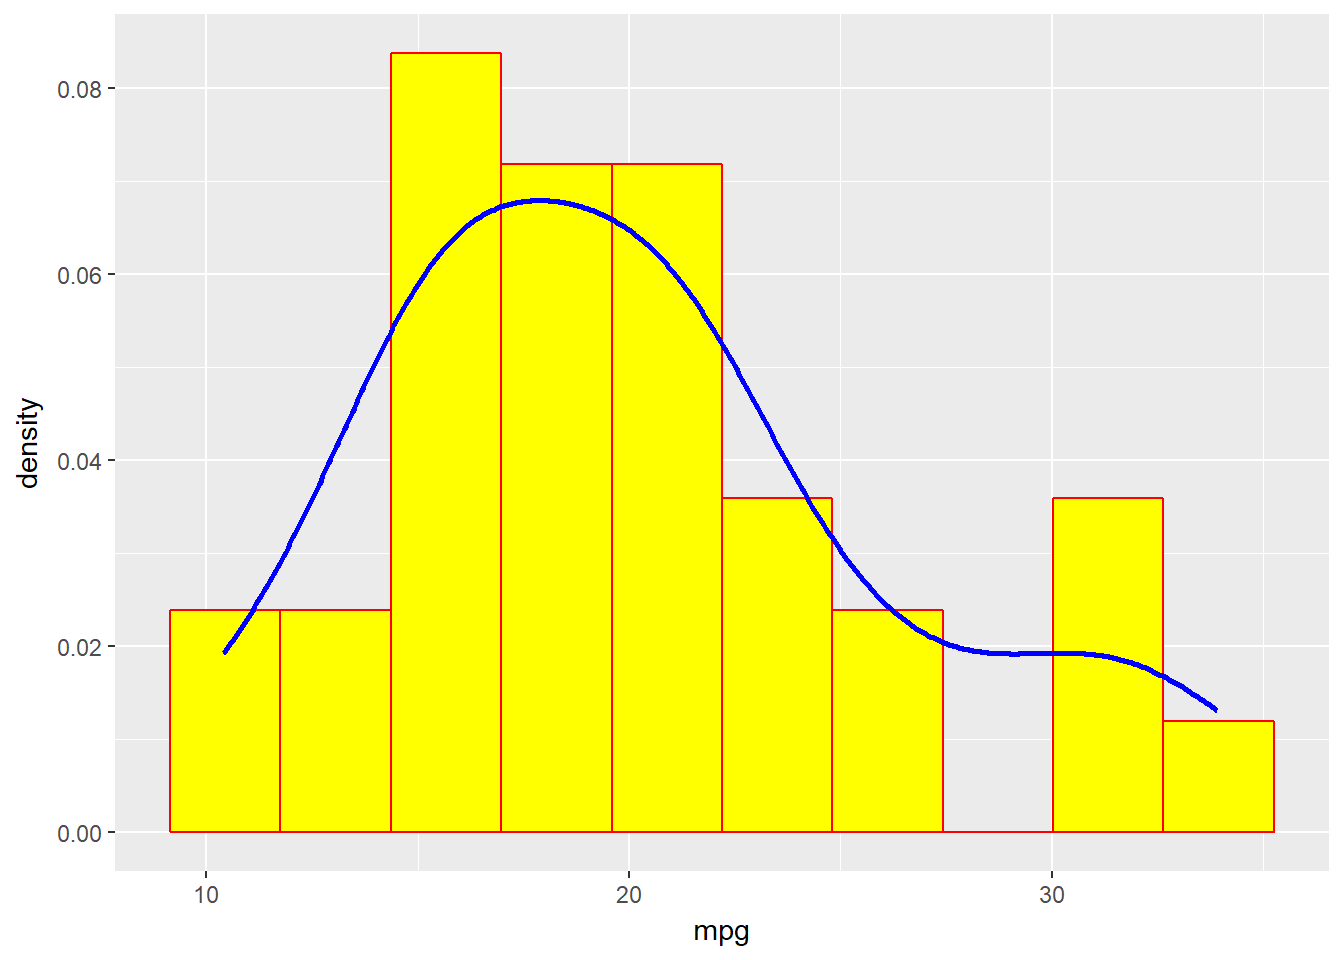
Multiple density plots
ggplot(mtcars, aes(x = mpg, color=factor(cyl))) + geom_density(size = 1)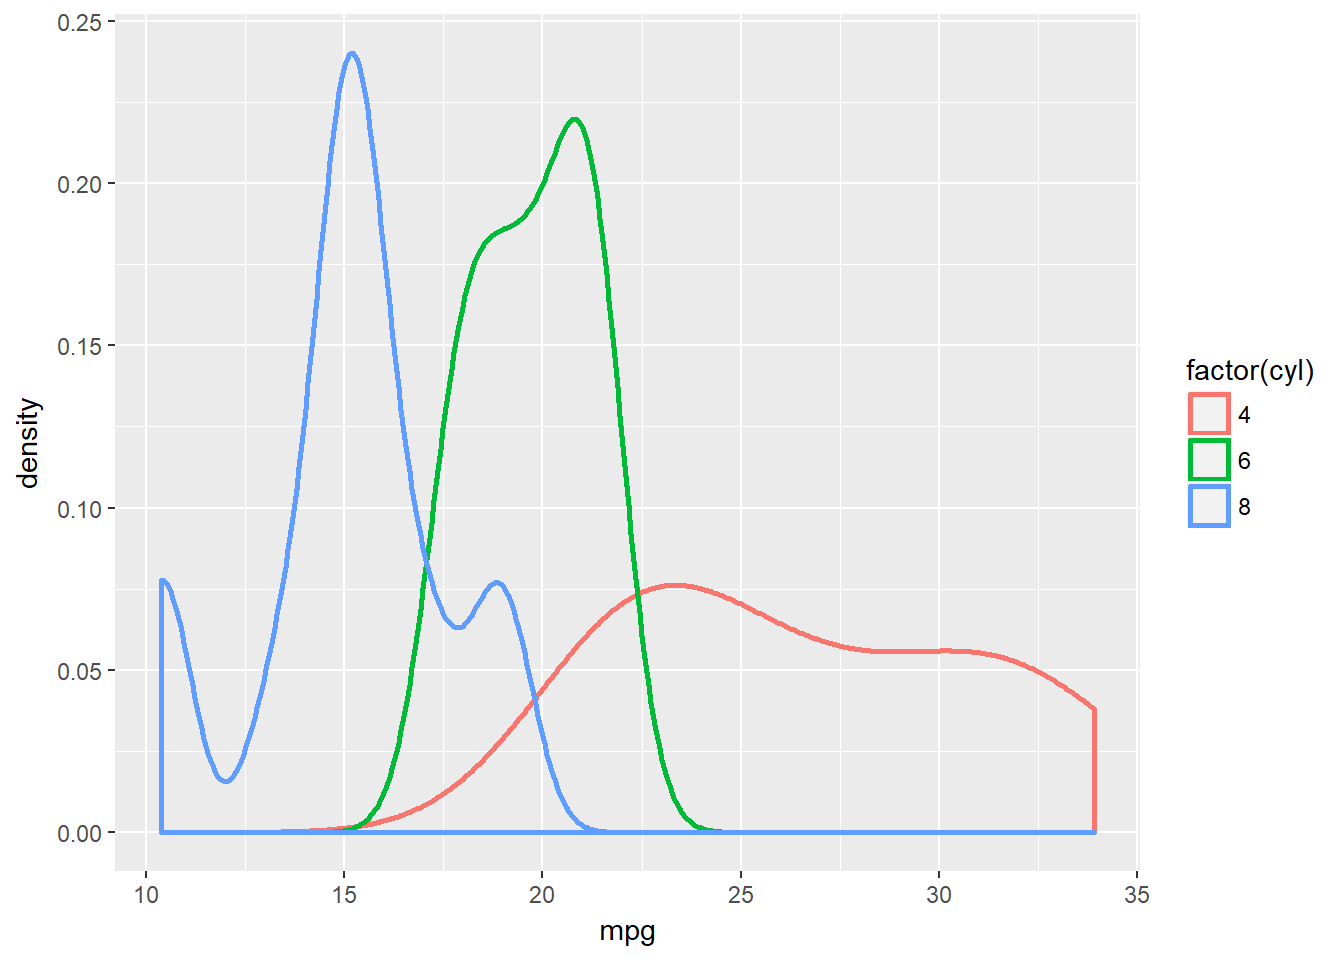
6.4 Dotplot
Needs one variable, x. Self explanatory.
ggplot(mtcars, aes(x=mpg)) + geom_dotplot(binwidth = 1)
6.5 Barplot
Barplots need two variables, a category, and a frequency against each category that determines the height of the bars. Sometimes, the data is available as list, and the frequencies need to be constructed. for example, consider the following:
x = c("a", "a", "a", "a", "b", "b", "b")
Identical to: > Cat Freq > a 4 > b 3
For the former, we use geom_bar(stat = "bin"), and for the latter we use geom_bar(stat = "identity"). For geom_bar, stat=“bin” is the default, so we can just use geom_bar(). For the latter, we can also use geom_col() which is identical to geom_bar(stat = "identity").
ggplot(mtcars, aes(x=factor(cyl))) + geom_bar(fill="lightblue", color = "black") #Illustration of geom_bar
Now consider the following:
ggplot(mtcars, aes(x = mpg)) + geom_histogram(bins=10, col = “black”, fill = “lightblue”) # Note that a histogram needs only one variable
x = data.frame(company = c("Goldman", "JPMC", "BofA", "Citi", "BNP", "Deutsche", "Barclays"),
               shareprice = c(235, 96, 25, 73, 68, 17, 10),
               region=c(rep("US",4), rep("EU", 3)))

ggplot(x, aes(x = company, y = shareprice)) + geom_col(aes(fill = region)) #How cool is that?
- Custom colors: You can pick the colors yourself instead of using defaults using
scale_fill_manual
- Custom bar widths: by setting
width =in thegeom_bar()function.
6.6 Boxplots
Using geom_boxplot(). In ggplot2, you need to provide it a discrete variable for x and a continuous variable for y. If you want to make just a single boxplot for the entire data, you can set x=1.
ggplot(mtcars, aes(x=1, y = mpg)) + geom_boxplot()
ggplot(mtcars, aes(x=factor(cyl), y = mpg)) + geom_boxplot()
- To change the width of the boxes, use
width = 0.5, for example, or any other number
- You can change the outlier points with
outlier.sizeandoutlier.shape
- You can create notches to make the median stand out
geom_boxplot(notch = TRUE)
- You can add a mean to a boxplot by
+ stat_summary(fun.y="mean", geom="point", shape=23, size=3, fill="red")
6.7 Adding lines
You can add various kinds of lines to graphs.
g = ggplot(mtcars, aes(x = mpg, y = disp)) + geom_point()  +
         geom_hline(yintercept = 104, color = "blue", size = 1.5) +
         geom_vline(xintercept = 26, color="red", linetype=2, size = 1) +
         geom_abline(intercept=100, slope = 3, color="darkgreen", size=1)
g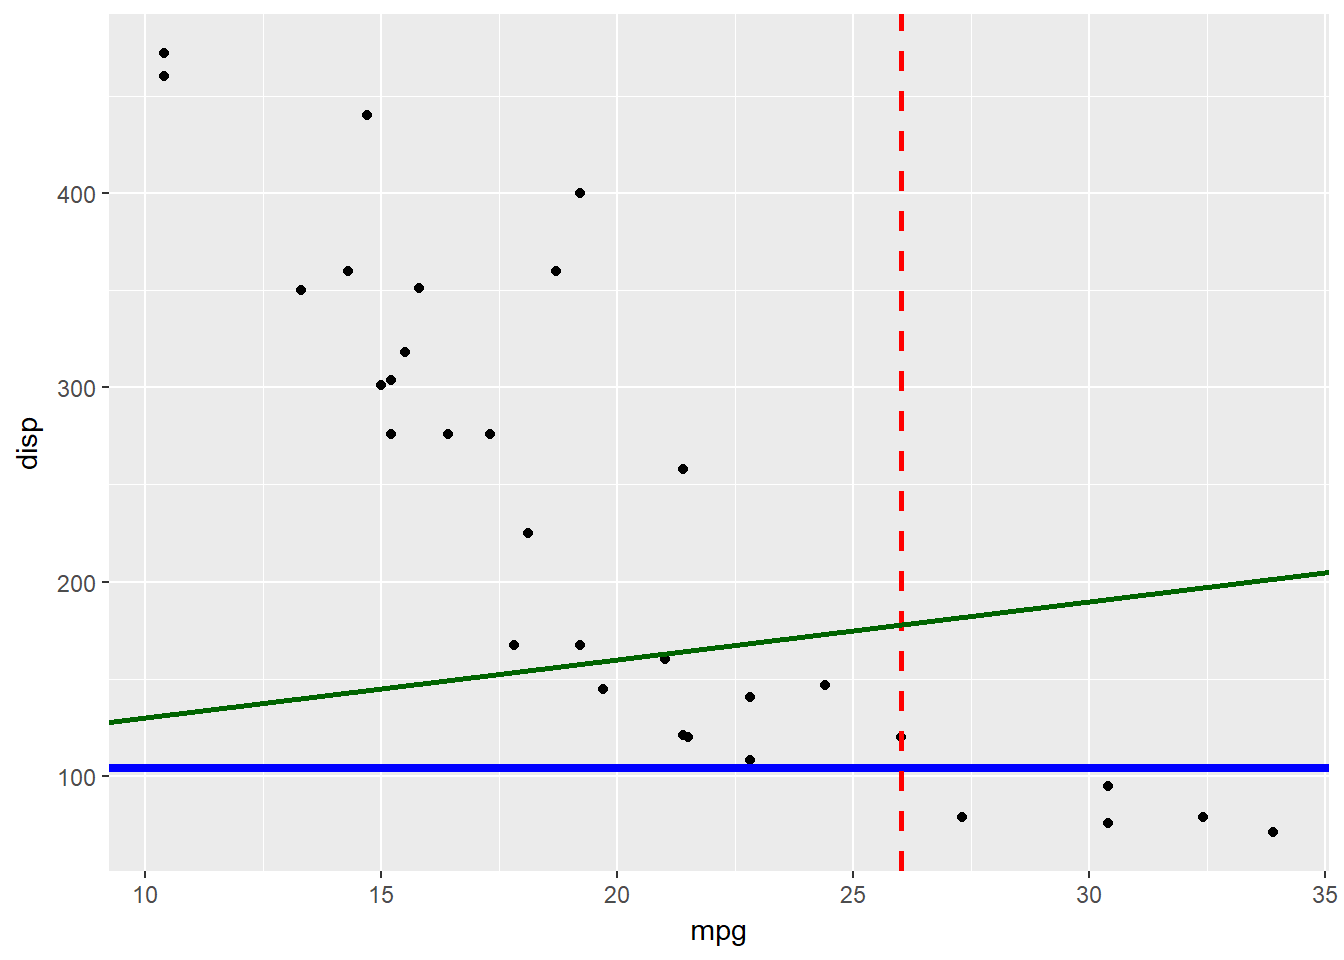
6.8 There is tons more!
If you can think it, you can probably do it with ggplot2. Often searching the web takes you to the answer right away.